
An In-depth research-based walk-through of an Uninitialized Local Variable Static Analyzer
Do you think the battle with ULVs is over? Think again.

TL;DR
They’re back!
Uninitialized local variables (ULVs) were once a common source of data leaks, crashes, and hard-to-explain bugs—ghosts of bad memory hygiene lurking in the stack. Today’s compilers are much better at catching them. But once binaries are stripped of metadata and debug info, those guarantees start to fade. So the question remains: are they really gone?
In stripped binaries, ULVs are no longer obvious—they’re buried under layers of optimization, inlined code, and restructured control flow. The compilers did their job. But for reverse engineers working without source, that same optimization turns variable tracking into a detective’s game: rebuilding the stack layout, tracing every read and write in intermediate representation, and cutting through the noise introduced by aggressive compiler behavior. Just a reminder - at least two uninitialized local variable (ULV) vulnerabilities were discovered in the Linux kernel last year (CVE-2024-42228, CVE-2024-42225).
This article presents a static analyzer based on Binary Ninja engine to take on that challenge. It walks through a complete ULV detection workflow—from recovering variables and analyzing how they’re used, to inferring sizes, tracking taints across functions, and filtering out misleading patterns. If an uninitialized read made it into your binary, this process will uncover it.
Introduction & Motivation
Stack-based uninitialized reads occur when a function reads from a local variable before any code assigns a value. In C/C++, this can expose residual stack contents—potential passwords, pointers, or other sensitive data—and lead to undefined behavior. While modern compilers insert some zeroing or warnings, many ULVs slip through in performance-critical code or legacy modules.
Static source analyzers can catch ULVs early, but in security research we often face only the compiled binary. Traditional disassembly and manual auditing are laborious and error-prone. My goal was to build an automated, accurate, and extensible Binary Ninja plugin that finds ULVs in stripped binaries with minimal human effort.
Finally, we chose Binary Ninja for its exceptionally powerful analysis engine, even if its user interface could be improved. Its Python-accessible intermediate representation with full SSA support greatly simplifies static analysis. At the same time, it keeps us close to the underlying assembly while allowing a higher-level perspective—and, by using the right IR, ensures our workflow remains ISA-agnostic (almost…).
Challenges in Binary-Only ULV Detection
Analyzing uninitialized local variables in a stripped binary comes with its own challenges. Since there's no extra information from the compiler, we don't know where variables start or how big they are. We have to figure out every stack variable just by looking at raw memory access patterns. Without type or symbol data, the only way to find variable boundaries is to study how memory is read from and written to. Small mistakes in this process can lead to missed bugs or confusing warnings.
Things added by the compiler make it even harder to understand what the code is really doing. For example, saved frame pointers, return addresses, padding for alignment, and situations where the compiler splits a single variable into multiple pieces on the stack can all look like real variables when they’re not. We also have to deal with complex control flow, where a variable might be initialized in one code path but not another. If we just scan the code in order, we might miss cases where a variable is used before it’s initialized, or we might wrongly report an error when all paths actually set the variable.
To make things even harder, variables are often initialized in helper functions that are called indirectly through pointers. This means that a write to a variable in one function might actually happen inside another function. If the analysis only looks at a single function, it might wrongly flag these safe pointer-based writes as problems.
Also, in large binaries, a lot of code either never runs or runs very rarely—like dead code or rarely-used error handlers. These parts can cause warnings that don’t matter for real-world use.
All of this means we need a broader kind of analysis that looks across functions. It has to be able to guess variable types and sizes without metadata, ignore extra data added by the compiler, and match what the code looks like with how it actually behaves when running.
A Binary Ninja–Powered ULV Detection Static Analysis
Having outlined the myriad challenges inherent in discovering uninitialized stack variables purely from binary code, we now turn to the heart of our solution: a script that automates this analysis. Leveraging Binary Ninja’s powerful Intermediate Language (IL) APIs, this plugin systematically reconstructs local variables, infers their sizes, tracks read‐before‐write occurrences, and propagates data flows across function boundaries. Keep in mind that this plugin is developed 4 years ago and this is a write-up for such an old plugin. The plugin works great, however, it needs the old version of BN which is 2.4.28x. After this version, vector35 changed their API engine from ground-up and I didn’t have time to keep-up and upgrade the implementation of this project. Nevertheless, even though the analyzer was written long ago, is still used today in our company and still can find vulnerabilities in modern binaries, while the logic does not rely on any modern libraries (the work done is static).
Over the next sections, we will explore in depth how the plugin works:
Discovers and filters stack locals using Binary Ninja’s stack_layout and configurable blacklists;
Performs read‐before‐write analysis by scanning MLIL instructions to accurately distinguish reads and writes;
Infers sizes for unknown‐width variables via a neighbor‐offset heuristic;
Reconstructs inter-procedural coverage with a proximity‐based taint propagation across caller–callee relationships;
Prunes false positives through sibling‐variable deduplication, pointer‐initiated initialization detection, and skips of specific-imported or dynamically called routines;
Enriches results by importing IDA Pro symbols for human-friendly names and filtering findings with a lightweight PIN trace to focus on actually executed code paths.
By the end of this discussion, you will see how each of these building blocks fits together into a coherent, end-to-end workflow—transforming a stripped binary into a prioritized list of genuine ULV warnings, ready for security review.
1. Discovering and Filtering Stack Locals
The very first challenge in binary‐only ULV detection is to reconstruct each function’s local variables purely from its stack frame, then immediately prune out any slots that cannot represent genuine user data. Our plugin addresses this in two sub-steps: enumeration via Binary Ninja’s stack_layout, and early filtering using blacklists and configurable flags.
Enumerating Stack Variables
Binary Ninja exposes each function’s local and argument slots through the Function.stack_layout property. Each entry describes a variable’s source type, name, storage offset (relative to the frame pointer), and any type information that the decompiler could recover. In our implementation, we iterate over every function in the binary view, skipping well‐known boilerplate functions (e.g., _init, __libc_csu_init) via a small functions_blacklist_names list:
functions_blacklist_names = ["__libc_csu_init", "_init", "_fini", "_start"]
allvars = {}

for func in bv.functions:
    if func.name in functions_blacklist_names:
        continue
    allvars[func.name] = {}
    for var in func.stack_layout:
        # ... candidate for further filtering ...
At this stage, func.stack_layout may contain entries for saved registers (e.g. __saved_rbp), return addresses, padding, or true locals. We capture each one but delay committing it until after filtering.
Blacklisting Compiler-Generated Slots
Many of the stack_layout entries are artifacts of the ABI or compiler: saved frame pointers, return addresses, preserved callee-saved registers, and so on. To exclude these, we maintain a variable blacklist of names that Binary Ninja commonly assigns to such slots:
variable_blacklist_names = [
    "__saved_rbp", "__return_addr",
    "__saved_rbx", "__saved_r12"
]
When populating our allvars structure, any Variable whose name matches an entry in this list is skipped:
if var.name in variable_blacklist_names:
    continue
This ensures we only consider slots that are more likely to hold program data rather than ABI bookkeeping.
Skipping Void and Zero-Size Slots
Even after name-based blacklisting, some locals have no meaningful width or type. Binary Ninja may tag them as void (unknown type) or assign a width of zero when it cannot infer any size. Since a void or zero-width slot cannot yield a usable read or write, we optionally skip them via two flags:
skip_void_vars      = False  # can be set to True to omit void-typed slots
skip_zero_size_vars = False  # can be set to True to omit zero-width slots

# inside the var loop:
if skip_void_vars and var.type.type_class == TypeClass.VoidTypeClass:
    continue

if skip_zero_size_vars and var.type.width == 0:
    continue
By default we leave these flags off (to maximize coverage), but they can be turned on for noise reduction in very large binaries.
Excluding Function Arguments on the Stack
Depending on calling convention, some function parameters may also appear in stack_layout. Since our focus is on automatic locals (and not on uninitialized caller-provided arguments), we exclude any variable whose storage is positive (i.e., above the frame pointer):
if var.storage > 0:
    # var.storage > 0 typically indicates a pushed‐in argument
    continue
Normalizing Offsets and Recording Initial State
For each surviving local, we record its normalized offset (var.storage + 8) to align with the prologue’s adjustment, its size (or zero if unknown), and an initial assigned state of 0 (meaning “unvisited”):
allvars[func.name][var.name] = {
    "func_obj":    func,
    "func_address":func.start,
    "type":        var.type,
    "storagetype": var.source_type,
    "offset":      var.storage + 8,
    "size":        var.type.width,
    "assigned":    0
}
That assigned field will later transition to 1 (read), 2 (written), or 3 (filtered false positive).
By the end of this discovery and filtering stage, allvars contains only the stack locals that could represent vulnerable uninitialized reads—each annotated with offset and size data. This concise set of candidates allows all subsequent analyses (read-before-write detection, size inference, taint propagation, and false-positive pruning) to focus exclusively on meaningful program data rather than compiler noise.
2. Read-Before-Write Analysis
Once we have a concise list of candidate locals in each function, the next step is to determine which of those are ever read before being written. A true uninitialized‐use occurs when an instruction consumes a variable’s value without any prior assignment. To detect this, the plugin leverages Binary Ninja’s Medium-Level IL (MLIL), which maps raw memory operations into explicit variable reads and writes, greatly simplifying the analysis.
MLIL and SSA Variables
In MLIL, each stack access such as [rbp - 0x20] is represented as a Variable (e.g. var_20) and, in SSA form, each assignment produces a fresh version (var_20#1, var_20#2, etc.). A use of the initial version (before any MLIL_SET_VAR) is a clear marker of reading an uninitialized value. By iterating through every func.mlil_instructions, we can inspect two key properties of each MLIL instruction:
instr.vars_read: the list of variables whose current version appears on the right-hand side (a read).
instr.vars_written: the list of variables that are assigned by this instruction (a write).
Assignment State Tracking
We track three states in each local’s assigned field:
0 — unvisited (no read or write seen yet)
1 — read-only (a read occurred before any write)
2 — written (at least one write has occurred)
The core loop looks like this:
# Initialize all locals to “unvisited”
for func in allvars:
    for v in allvars[func].values():
        v["assigned"] = 0

# Scan MLIL instructions for reads and writes
for func in bv.functions:
    if func.name not in allvars:
        continue

    for instr in func.mlil_instructions:
        # Mark reads that occur before any write
        for vr in instr.vars_read:
            entry = allvars[func.name].get(vr.name)
            if entry and entry["assigned"] == 0:
                entry["assigned"] = 1

        # Mark any writes (these clear a previous “read-only” state)
        for vw in instr.vars_written:
            entry = allvars[func.name].get(vw.name)
            if entry:
                entry["assigned"] = 2
As soon as a variable is read with assigned == 0, it transitions to 1, flagging a potential ULV.
If a write is seen at any point, we set assigned = 2, indicating the variable has been initialized.
Identifying ULV Candidates
After this pass, any local with assigned == 1 represents a stack variable that was read before any write in that function. These are our initial ULV candidates. Variables with assigned == 0 were never used and are ignored, while those with assigned == 2 were always written before use.
By using MLIL’s explicit variable tracking rather than raw disassembly, this approach accurately captures read-before-write behavior—even in the presence of compiler optimizations such as reordering of memory operations or introduction of temporary variables. In the next section, we will see how unknown sizes are inferred for zero-width locals, enabling us to distinguish partial from full initialization.
3. Inferring Sizes for Unknown-Width Variables
In practice, Binary Ninja often labels stack slots with zero width when it cannot recover a concrete type or size—particularly for anonymous arrays or structs that lack debug metadata. Without knowing a variable’s true length, we cannot distinguish a fully uninitialized buffer from a partially initialized one. To address this, the plugin implements a neighbor-offset heuristic in the “predictSize” function, inferring a plausible size for any zero-width local by examining its surrounding stack layout.
When Size Inference Kicks In
During initial discovery (see Section 1), each local’s size is set to var.type.width. If that width is zero and the flags fix_zero_size_vuln_var is enabled while skip_zero_size_vars is disabled, the plugin calls predictSize to compute a nonzero length:
elif skip_zero_size_vars == False and fix_zero_size_vuln_var and var.type.width == 0:
    var_size = predictSize(var, func.stack_layout)
This ensures that every local we analyze has a meaningful “size” associated with its stack offset.
Rationale and Effectiveness
Most compilers allocate locals contiguously in the prologue, reserving one block of stack space for all variables. By measuring the distance to the next allocated slot, we obtain a conservative upper bound on the buffer’s length without needing symbolic execution or partial SSA reconstruction. This inferred size is critical when later determining whether a given function’s writes fully cover the buffer or leave trailing bytes uninitialized.
With every local now annotated with either its original width or an inferred size, the plugin can accurately distinguish:
Full Cover: All bytes in [offset, offset+size) are written before any read.
Partial Cover: Only a prefix of the buffer is written, leaving some bytes uninitialized.
This size inference lays the groundwork for precise interprocedural coverage analysis in the next stage.
4. Reconstructing Interprocedural Coverage & Taint Propagation
A key insight in uncovering real ULVs is that uninitialized data often traverses multiple functions before it is ultimately consumed. To expose these propagation chains, the plugin correlates the point of uninitialized read in one function (“Affected”) with potential initializer calls in its callers (“Middle” and “Parent”). This interprocedural analysis proceeds in two phases: identifying cross-references between functions, and then determining which callee writes cover the target stack offset most closely before the uninitialized read.
Gathering Call-Site References
First, for each function func that contains a ULV candidate var, we locate:
All callers of func via bv.get_callers(func.start).
All xrefs (cross-references) within each caller where func is invoked, using:
def getFunctionReferencedAddresses(func, parent_func):
	total_refs = list()
	func_xrefs = bv.get_callers(func.start)
	for f_xref in func_xrefs:
		if f_xref.function.name == parent_func.name:
			total_refs.append({"xref":f_xref, "index":parent_func.get_llil_at(f_xref.address).instr_index})
	return total_refs
Each record contains both the xref object (with its address) and the MLIL instruction index, which we use to compare ordering within the parent function.
Identifying Candidate Initializers
Within each parent function, we also enumerate all its callees (other functions it calls) and gather their xrefs in the same way. For each potential “middle” function call, we now have the list of points in the parent where it is invoked.
Proximity Heuristic for Coverage
For each uninitialized‐read reference (var_ref) in the parent, we look backwards at all candidate calls to see which one both:
Occurs before var_ref in the instruction stream (i.e., xref.address < var_ref.address and xref.index < var_ref.index), and
Writes to the stack offset of interest, as determined by func_called(callee, var_offset, var_size).
The plugin computes a simple distance metric—var_ref.address - callee_xref.address—and selects the callee with the smallest positive distance. This “closest writer” is most likely responsible for initializing (or partially initializing) the buffer before its uninitialized use:
best_distance = None
best_cover    = VAR_NOCOVER
for parent_out in parent_out_refs:
    for call_record in parent_out["xrefs"]:
        if call_record["xref"].address < var_ref["xref"].address:
            distance = var_ref["xref"].address - call_record["xref"].address
            cover_info = func_called(parent_out["parent_out"],
                                     offset, size)[0]["cover"]
            if cover_info != VAR_NOCOVER and (best_distance is None or distance < best_distance):
                best_distance = distance
                best_cover    = cover_info
                best_callee   = parent_out["parent_out"]
                best_xref     = call_record["xref"].address
Here, func_called inspects the callee’s own MLIL for writes at the given offset and returns VAR_FULL_COVER, VAR_PARTIAL_COVER, or VAR_NOCOVER.
Building the Call Chain
Once the best covering function is identified, we record a propagation record linking:
Parent Function and the exact call-site of the uninitialized read.
Middle Function (the chosen callee) and its call-site.
Affected Function (original func) and the address of the problematic read.
By repeating this for every ULV candidate, the plugin constructs full Parent→Middle→Affected chains, capturing where the buffer originates, how it is partially initialized, and where the uninitialized portion is ultimately used.
Why This Approach Works
IL Abstraction: By operating on IL engine’s explicit variables and instruction indices, we bypass many assembly-level quirks and focus on logical data flows.
Proximity Metric: In most real binaries, the function that initializes a stack slot will be called most closely before its use; selecting by minimal distance leverages this common pattern without full CFG reconstruction.
Per-Offset Coverage: Checking writes to the exact byte-range of interest (using normalized offsets and inferred sizes) ensures that we distinguish full from partial initialization.
This interprocedural coverage analysis transforms isolated read-before-write flags into meaningful vulnerability traces, revealing not only that a ULV exists, but how it traverses the call stack to become a real-world issue.
5. Pruning False Positives
Sibling-Variable Deduplication
In many binaries, the decompiler will introduce multiple local-variable symbols that actually refer to the same stack location—often as artifacts of different analysis passes or name collisions. To prevent reporting the same uninitialized region more than once, the plugin groups such “sibling” symbols by their stack-frame offset. During the coverage analysis, any two variables found at the exact same offset are identified, one is marked as the canonical representative, and the other is dropped from further consideration. This ensures that a single physical buffer on the stack generates at most one warning, rather than duplicate entries under different names.
Static Duplicate-Offset Filtering
Beyond simple sibling grouping, the analysis also looks for cases where one of two variables at the same offset is never read at all. If only one symbol is ever accessed and its duplicate is never used, the plugin interprets the accessed symbol as a likely disassembler artifact and discards it outright. By detecting these static duplicate–offset pairs early—before any interprocedural work—false positives stemming from redundant naming are eliminated with minimal overhead.
Read/Write Assignment Tracking
At the heart of uninitialized-variable detection is the ability to distinguish between reads and writes. The plugin first assumes every local is “unvisited,” then scans each instruction: when a variable is written (assigned), it is marked as initialized; when it is read without any prior write, it is flagged as a potential issue. Only those locals that transition from unvisited straight to read-only are surfaced as uninitialized-use candidates. This precise, per-instruction bookkeeping guarantees that correctly initialized variables (even if initialized late in the function) are never misreported.
Void-Type and Zero-Size Variable Filtering
Compiler-generated placeholders and padding areas often appear in the decompiler output as stack slots of void type or zero length. Since these cannot represent meaningful storage, the plugin offers configurable filters to skip them entirely. In the initial gathering of locals, any slot whose type is classified as “void” or whose width is zero is omitted when the corresponding skip flags are enabled. This preemptive pruning removes noise by excluding regions that could never hold legitimate data.
Imported-Function Coverage Skips
Calls to external libraries or dynamically linked functions have unknown behavior when it comes to local stack variables. To avoid wrongly assuming that these functions initialize or interact with locals, the plugin checks if the called function is located in the PLT (Procedure Linkage Table) or in an external range defined by the user. If a function is identified this way, it’s treated as having “no coverage” for the target variable—meaning it’s not credited with initializing it. This prevents the analysis from incorrectly suppressing uninitialized local variable (ULV) warnings when the real behavior of the external function isn’t known.
However, this area is still uncertain. In some cases, external functions do play a critical role in initialization, and treating them as “no coverage” can lead to extra false positives. Because of that, we leave this as a configurable option—a flag the researcher can turn on or off. Whether to include these functions in the analysis depends on the specific binary and how much false-positive noise you're willing to tolerate based on how these external calls behave.
Dynamic-Function-Address Heuristic
When a function call goes through a register or function pointer, its target can’t be figured out just by looking at the static code. So, the analysis can’t tell if the function being called actually writes to the variable or not.
To avoid making unsafe assumptions, there’s a setting you can turn on that tells the plugin to play it safe: if the call target is unknown, just assume it might initialize the variable. In that case, the possible uninitialized variable is removed from the report.
This heuristic helps cut down on false positives caused by indirect calls, where the real behavior of the function isn’t visible in static analysis.
Finally, a Unified False-Positive Marking
All filtered cases—whether from duplicate-offset removal, sibling deduplication, imported-function skips, or pointer-initiated initialization—are consolidated by marking the variable’s internal state as “false positive.” During the final report generation, any variable with this marker is uniformly excluded. By centralizing all pruning logic into a single assigned state, downstream parsing and triage remain straightforward, ensuring that only genuine read-before-write issues reach the analyst.
6. Enriching Results with IDA Pro Integration and PIN-Based Execution-Trace Filtering
To transform raw ULV candidates into actionable findings, the plugin incorporates two complementary enrichment steps: importing accurate function names from an IDA Pro export, and filtering static results against a dynamic call trace captured with Intel PIN.
IDA Pro Symbol Import
Stripped binaries lack meaningful symbols, making it difficult to triage ULV reports. To remedy this, the plugin can ingest a JSON mapping of function names to addresses generated by a IDA Pro script. This mapping is produced by an IDA Python script such as:
# In IDA Pro:
import idautils, idc, idaapi, json

ida_map = {}
for addr in idautils.Functions():
    name = idc.get_func_name(addr)
    ida_map[name] = hex(addr)

with open("ida_funcs.json", "w") as f:
    json.dump(ida_map, f)
Within the Binary Ninja plugin, these symbols are defined before analysis begins:
def loadIdaFuncNames(fname):
    ida_functions = json.loads(open(fname, "r").read())
    for funcname, addr_hex in ida_functions.items():
        addr = int(addr_hex, 16)
        sym = Symbol("FunctionSymbol", addr, funcname)
        bv.define_user_symbol(sym)
By calling loadIdaFuncNames("ida_funcs.json"), Binary Ninja’s symbol table is populated with human-readable names. Subsequent ULV reports (in JSON or text) reference these names and addresses directly, greatly simplifying vulnerability triage and patching.
Intel PIN–Based Execution-Trace Filtering
Static analysis can over-report in dead or rarely exercised code paths. To focus on vulnerabilities that matter under real workloads, we use a minimal PIN tool that logs every executed function call, then cross-references this trace with the ULV findings.
PIN Instrumentation (C++):
... SNIP ...

// Called before every call instruction
VOID OnCall(ADDRINT ip, ADDRINT target) {
    out << std::hex << ip << " " << target << "\n";
}

VOID Trace(TRACE trace, VOID *) {
    for (BBL bbl = TRACE_BblHead(trace);
         BBL_Valid(bbl); bbl = BBL_Next(bbl)) {
        for (INS ins = BBL_InsHead(bbl);
             INS_Valid(ins); ins = INS_Next(ins)) {
            if (INS_IsCall(ins)) {
                INS_InsertPredicatedCall(
                    ins, IPOINT_BEFORE, (AFUNPTR)OnCall,
                    IARG_INST_PTR, IARG_BRANCH_TARGET_ADDR, IARG_END);
            }
        }
    }
}

... SNIP ...
What it does: Each executed call logs the instruction pointer and the call target to pinout.txt.
Result: A trace of which functions (by address) were actually invoked during a program run. The cool thing here is that the address where the function were exactly called, is noted and saved. That’s a sweet xref out of runtime execution for each and for every function call (functions treated as code segment and jumped on it - odd compiler stuff - are ignored).
Parsing and Filtering in Python:
In the ULV parsing script, we load the PIN trace and build a set of covered functions:
def filterWithTrace(fname):
    trace = {}
    lines = open(fname).read().splitlines()
    # First line is the image base; skip or record if needed
    for line in lines[1:]:
        src_hex, dst_hex = line.split()
        # Normalize addresses relative to image base here if necessary
        trace.setdefault(dst_hex, []).append(src_hex)
    return trace

# Later, when printing each ULV record:
if analyze_trace_file:
    trace = filterWithTrace("pinout.txt")
    # Skip any ULV whose functions were not covered
    if (hex(vuln_addr) not in trace or
        hex(middle_addr) not in trace or
        hex(affected_addr) not in trace):
        continue
    ... display results ...
Configuration: Set analyze_trace_file = True and point to your pinout.txt.
Effect: Any ULV whose Parent, Middle, or Affected function did not appear in the execution trace is omitted from the run-specific report.
By enriching static ULV data with IDA Pro symbols and PIN-driven coverage, the plugin delivers a final output that is both human-readable and focused on real execution paths—a powerful combination for efficient vulnerability review and triage.
Parsing and displaying the data
Structured JSON Ingestion
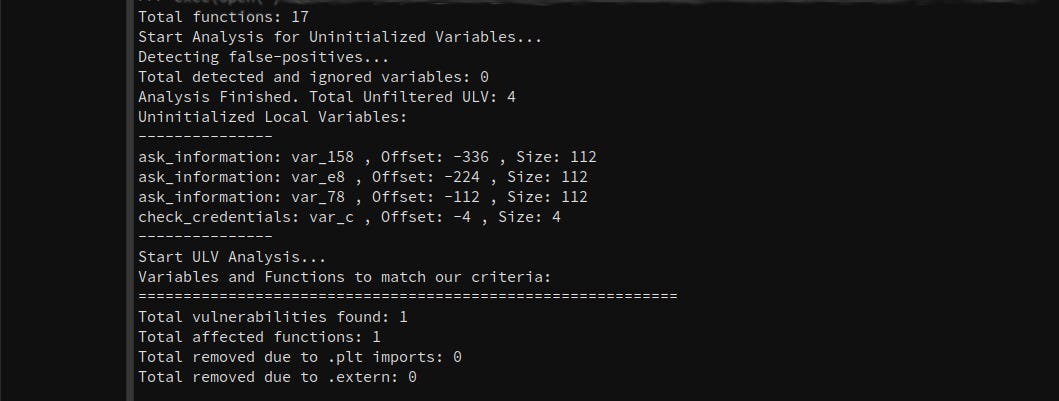
After our Binary Ninja plugin completes its analysis, it emits a comprehensive JSON file (ulv_analysis_*.json) that captures, for every function and variable, a list of propagation records (parent, middle, affected functions, offsets, sizes, and coverage status). The parser reads this JSON directly, trusting that each record encodes the full context of an uninitialized-variable finding. By decoupling data generation from reporting, we can evolve the analysis engine independently of how results are presented.
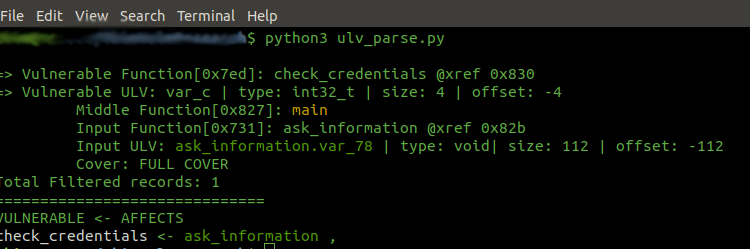
Colorized, Intuitive Console Output
To aid rapid triage, we leverage the termcolor library to highlight key elements in the console: vulnerable pointers (in red), intermediary function names (in yellow), and input functions that introduce the uninitialized data (in green). When PIN-based trace filtering is active, functions confirmed as executed appear in blue. This visual language lets me—and anyone reviewing our findings—scan dozens of records in seconds and immediately spot the most important flows.
Trace-Driven Filtering
Static analysis often yields warnings in code paths that never actually run. To focus on real, exploitable issues, the parser can ingest the pinout.txt generated by our Intel PIN tool. It builds a set of all executed callee addresses and then discards any ULV record whose parent, middle, or affected function didn’t appear in the trace. This simple yet effective step transforms a long static report into a focused list of vulnerabilities observed under actual workloads.
Flexible Whitelists and Blacklists
Every codebase has its own quirks and known false positives. I’ve added support for user-defined lists—blacklist_vuln_funcs, false_negatives_vuln, false_negatives_input, and an optional whitelisted_only set—that let us suppress or focus on specific functions. This makes the parser adaptable: whether conducting an initial broad sweep or zeroing in on a mission-critical module, I can tailor the report to exactly what I need to investigate.
High-Level Relationship Overview
Finally, after printing each detailed record, the parser compiles a streamlined “VULNERABLE ← AFFECTS” table. For every vulnerable function, it lists the input functions responsible for tainting its variables. This bird’s-eye overview reveals which routines serve as common entry points for uninitialized data, guiding subsequent fuzzing or manual review. In practice, this summary often highlights unexpected hotspots that merit deeper investigation.
Together, these features make the parser not just a reporting tool, but an interactive companion in the vulnerability-discovery process—one that adapts to our evolving needs, surfaces the most relevant findings, and accelerates the path from analysis to remediation.
In a nutshell
Finding uninitialized stack variables in a stripped binary can feel like hunting ghosts in the machine. With this Binary Ninja plugin, however, the process becomes clear and manageable. We start by rebuilding each function’s local variables from the stack frame, then use MLIL to spot any reads that happen before a write. When the size of a buffer is unknown, a simple neighbor-offset trick fills in the gaps. Next, we follow the data across functions to see exactly where it was partially initialized and then finally used without initialization. False alarms are swept away by combining sibling-variable checks, pointer-taint tracking, and sensible skips for external or indirect calls.
To make the results truly actionable, we round out the approach with two powerful additions: importing accurate function names from an IDA Pro export, and filtering against a real execution trace captured by PIN. This means every warning in your report isn’t just a line in a file—it’s a named function that you know actually ran, with a clear story of how uninitialized data flowed through your code.
In practice, this workflow turns a daunting manual effort into an automated, repeatable audit. Whether you’re examining legacy software with no source or vetting a new build for hidden leaks, this plugin shines a spotlight on the most critical uninitialized-variable issues first.
More of this?
We also welcome collaboration with universities, research institutes, and industry partners on shared projects. If you’d like to discuss joint research or integration efforts, please feel free to connect with the author on LinkedIn (Theodoros Danos) or send an email to Cybervelia. We look forward to exploring new opportunities together!
The analyzer’s code is strictly available only to selected research institutes.
Possible enhancements
We would like to blend-in some SMT-solvers in order to glue the sinks with the affected variables. That would be really cool but symbex requires a bit more effort and that alone is just one of the ideas.
Our current interprocedural analysis examines only a single level of the call stack when correlating functions. Extending this to multiple layers would greatly enhance our ability to trace complex call chains. For example, consider a scenario where Function A calls B, B calls C, and C calls D—and it is D’s behavior that is ultimately influenced by an uninitialized variable in A. With multi-layer depth, we could uncover that relationship; as it stands, we only analyze direct parent-child interactions.
Another enhancement is to grab and enhance the function names such as including System map and other files which will help the function-name decoding - even though this has nothing to do with ULV, it simplifies the whole process.
Finally, it would be super-interesting if we would involve LLMs to validate/invalidate affected functions found by the tool!